Microsoft Power Platform: What is Power BI (Business Intelligence)?
Discover Power BI - It makes it possible to enable everyone at every level of your organization to make confident decisions using up-to-the-minute analytics.

Imagine this. Your car has a dot matrix printer in the trunk that is connected to the axle and prints a line for every km you travel. You know that your fuel tack capacity is 51l, and through years of manual analysis, you have concluded that you get an average of 6.4 litres/100 km or 15 km’s for every litre. Every time you fill up, you write on the printed report the data and litres added (important that you always fill the tank completely or this causes extra calculations). Every couple of days, you manually add up the lines since you last filled up and calculate the approximate km’s left on your tank, making a note on the report to simplify the next ‘check’. Being human, you forget to add the note on when you filled the tank, or the printer ribbon goes dry (not printing), and suddenly you find yourself without fuel, in the middle of nowhere.
Sounds silly right?
Well, not if you think that many companies manage their financials and projections in exactly this way. Visual, real-time reporting gives us the ability to not only make better informed decisions but also a lot faster. Thank goodness our cars have dashboards to help us monitor ‘usage’. Inserting charts in Excel was the beginning of this evolution and Power BI takes us to the next step.
So, what is Power BI exactly?
Microsoft Power BI is a business intelligence platform that provides non-technical business users with tools for aggregating, analysing, visualising, and sharing data. Power BI’s user interface is fairly intuitive for users familiar with Excel. Its deep integration with other Microsoft products makes it a very versatile self-service tool that requires little upfront training.
A free version of Power BI is available and applicable in many cases. A payable monthly user subscription called Power BI Premium or Power BI Pro are also available if you need to share and collaborate or even use AI on your reports. Users can download an application for Windows 10, called Power BI Desktop, and native mobile apps for Windows, Android, and iOS devices. There is also Power BI Report Server for companies that maintains their data and reports on-premises. That version of Power BI requires a special version of the desktop app – aptly called Power BI Desktop for Power BI Report Server.
Common uses of Power BI
Microsoft Power BI is used to find insights within an organisation’s data. Power BI can help connect disparate data sets, transform, and clean the data into a data model to create charts or graphs and provide visuals of the data. All this can be shared with other Power BI users within the organisation.
The data models created from Power BI can be used in several ways for organisations, including telling stories through charts and data visualisation and examining “what if” scenarios within the data. Power BI reports can also answer questions in real time and help with forecasting to make sure departments meet business metrics.
Power BI can also provide executive dashboards for administrators or managers, giving management more insight into how departments are doing.
Who uses Power BI?
Power BI is a self-service BI tool that brings data analytics to employees. It’s mostly used by data analysts and business intelligence professionals who create the data models before sending reports throughout the organisation. However, those without an analytical background can still navigate Power BI and create reports.
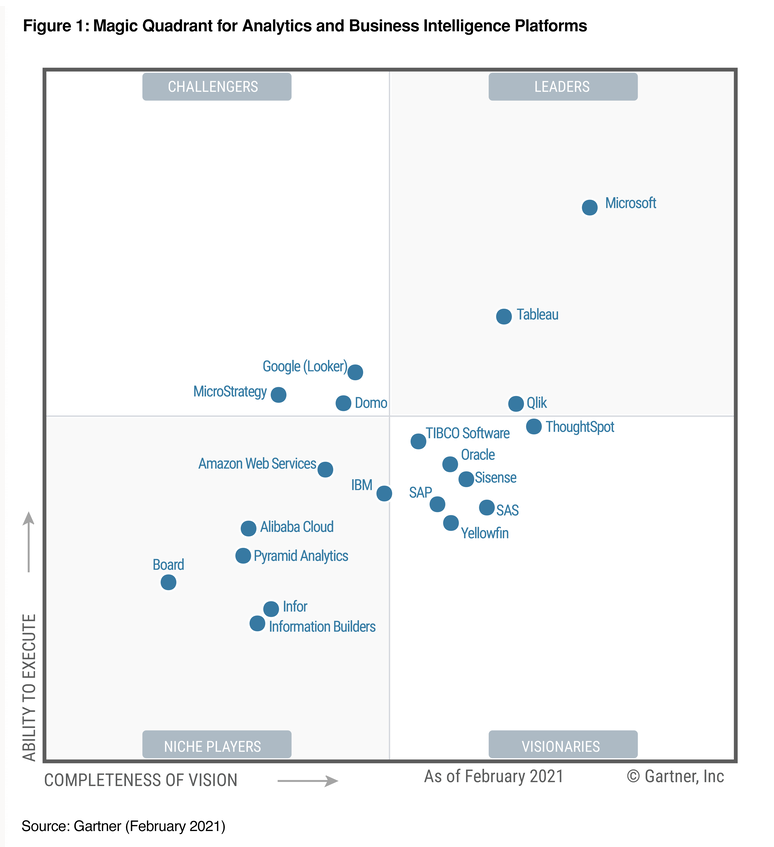
Microsoft Power BI is used by both department leaders and management, with reports and forecasts created to aid sales and marketing leaders, while also providing data for management on how the department or individual employees are progressing toward their goals. For that reason, Gartner recognised Microsoft, for 14 consecutive years as a Magic Quadrant Leader in analytics and business intelligence platforms.
In addition, Power BI offers an admin portal for administrators to help configure the implementation of Power BI, as well as usage monitoring and licenses.
Key features of Power BI
Since its start, Microsoft has added a number of data analytics features to Power BI and continues to do so. Some of the most key features include:
Quick Insights - This feature allows users to create subsets of data and automatically apply analytics to that information.
Common data model support - Power BI’s support for the common data model (Dataverse) allows the use of a standardised and extensible collection of data schemas (entities, attributes, and relationships)
Artificial Intelligence – Users can access image recognition and text analytics in Power BI, create machine learning models using automated machine learning capabilities and integrate with Azure Machine Learning.
Hybrid deployment support - This feature provides built-in connectors that allow Power BI tools to connect with a number of different data source from Microsoft, Salesforce, and other vendors.
Cortana integration - This feature, which is especially popular on mobile devices, allows users to verbally query data using natural language and access results, using Cortana, Microsoft’s digital assistant.
Customisation – This feature allows developers to change the appearance of default visualisation and reporting tools and import new tools into the platform.
APIs (application performance interfaces) for integration - This feature provides developers with sample code and application performance interfaces (APIs) for embedding the Power BI dashboard in other software products.
Self-service data prep - Using Power Query, business analysts can ingest, transform, integrate and enrich big data into the Power BI web service. Ingested data can be shared across multiple Power BI models, reports, and dashboards.
Modelling view - This allows users to divide complex data models by subject area into separate diagrams, multiselect objects and set common properties, view and change properties in the properties pane, and set display folders for simpler consumption of complex data models.

Conclusion
Power BI has become an indispensable tool for many companies around the world. When your data is gathered and visualized in a uniform and clear way – you can read and understand the numbers quickly, making the decision making the decision-making process a lot faster. Data based decisions make sure your beverage business runs on facts and figures and not on guesses.
